Performance Monitoring
Description
Our Performance Monitoring for Magento 2 will help merchants and admins to carefully track their Magento 2 online stores performance. This multifunctional extension preserves statistics and CPU load details in the database. It allows checking statistics in a historical context and right at the moment.
Key features:
- Get CPU and RAM load history
- Check if Random Access Memory is sufficient
- Apply email notifications when Central Processing Unit load is high
- Get the list of top website and system transactions
- Select specific periods of time with the date-picker
- Utilise the System and PHP info output
Find out how to install the Performance Monitoring for Magento 2 via Composer.
Note
All Aitoc extensions can be customised to fit particular business needs. If you have questions about any customization, please drop a message at [email protected]
Compatibility
Performance Monitoring module is compatible with the following Magento platforms:
| Community Edition (Open Source) | Enterprise Edition (Commerce) | Cloud Edition |
|---|---|---|
| 2.3.0 - 2.4.* | 2.3.0 - 2.4.* | 2.3.0 - 2.4.* |
Configuration
General
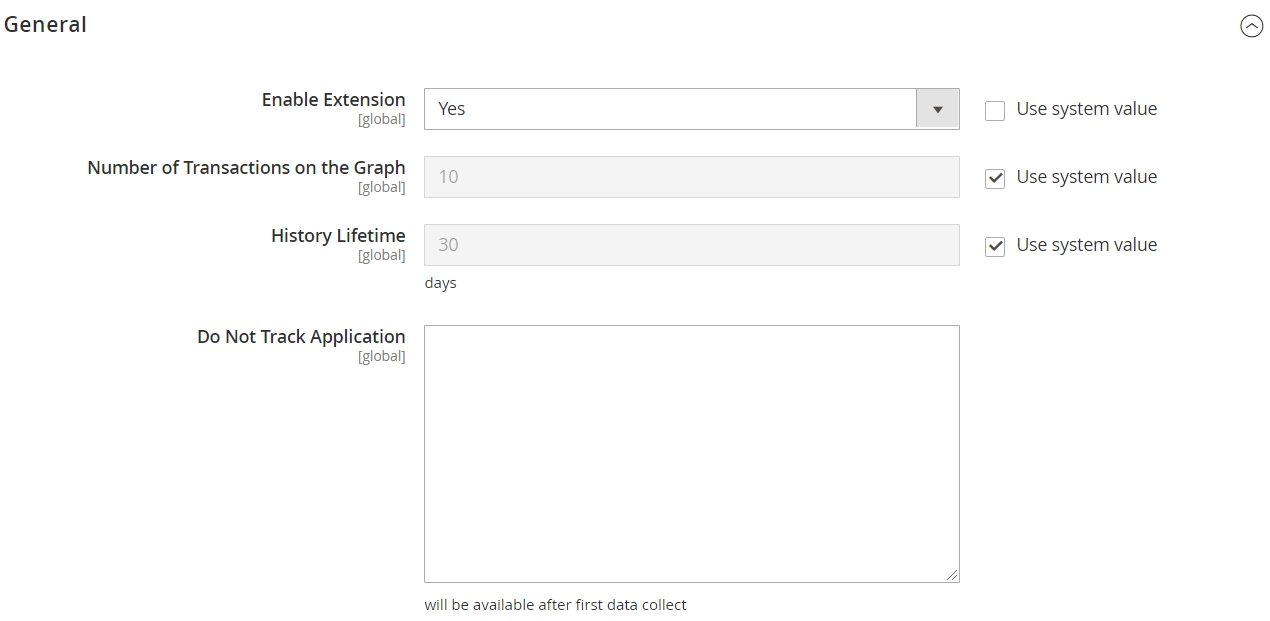
To get started, go to STORES → CONFIGURATION → AITOC EXTENSIONS → PERFORMANCE MONITORING → GENERAL to configure the extension.
Here you can Enable/Disable the module.
| Field | Specification |
|---|---|
| Number of Transactions on the Graph | Here it can be limited for your convenience. |
| History Lifetime | The storage period is 30 days by default, but you're able to modify it in this field. |
| Do Not Track Application | Some applications can be removed from the report for your convenience. |
Alerts
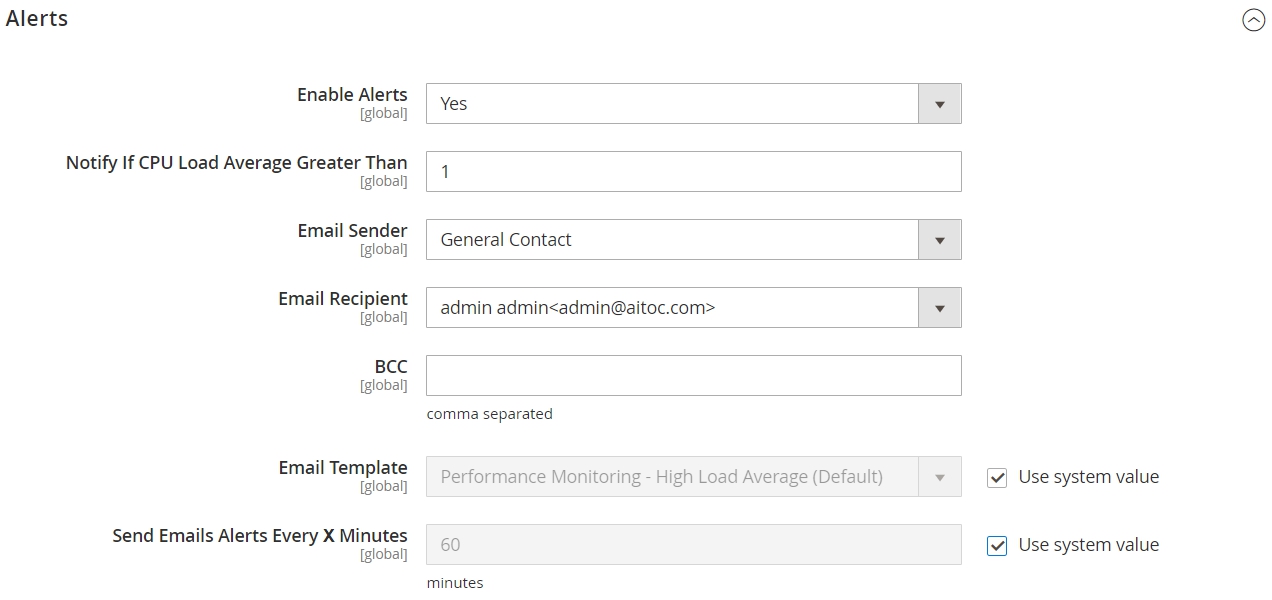
This extension can also be configured to send email notifications to an admin if CPU usage has become too high. This will help the store administrator to react timely.
Performance Monitoring Page
Please go to REPORTS → PERFORMANCE MONITORING.
Here you have 4 tabs: 1. Overview
-
CPU Usage
-
Memory Usage
-
PHP Information
Let's take a look at each of them.
Overview Tab
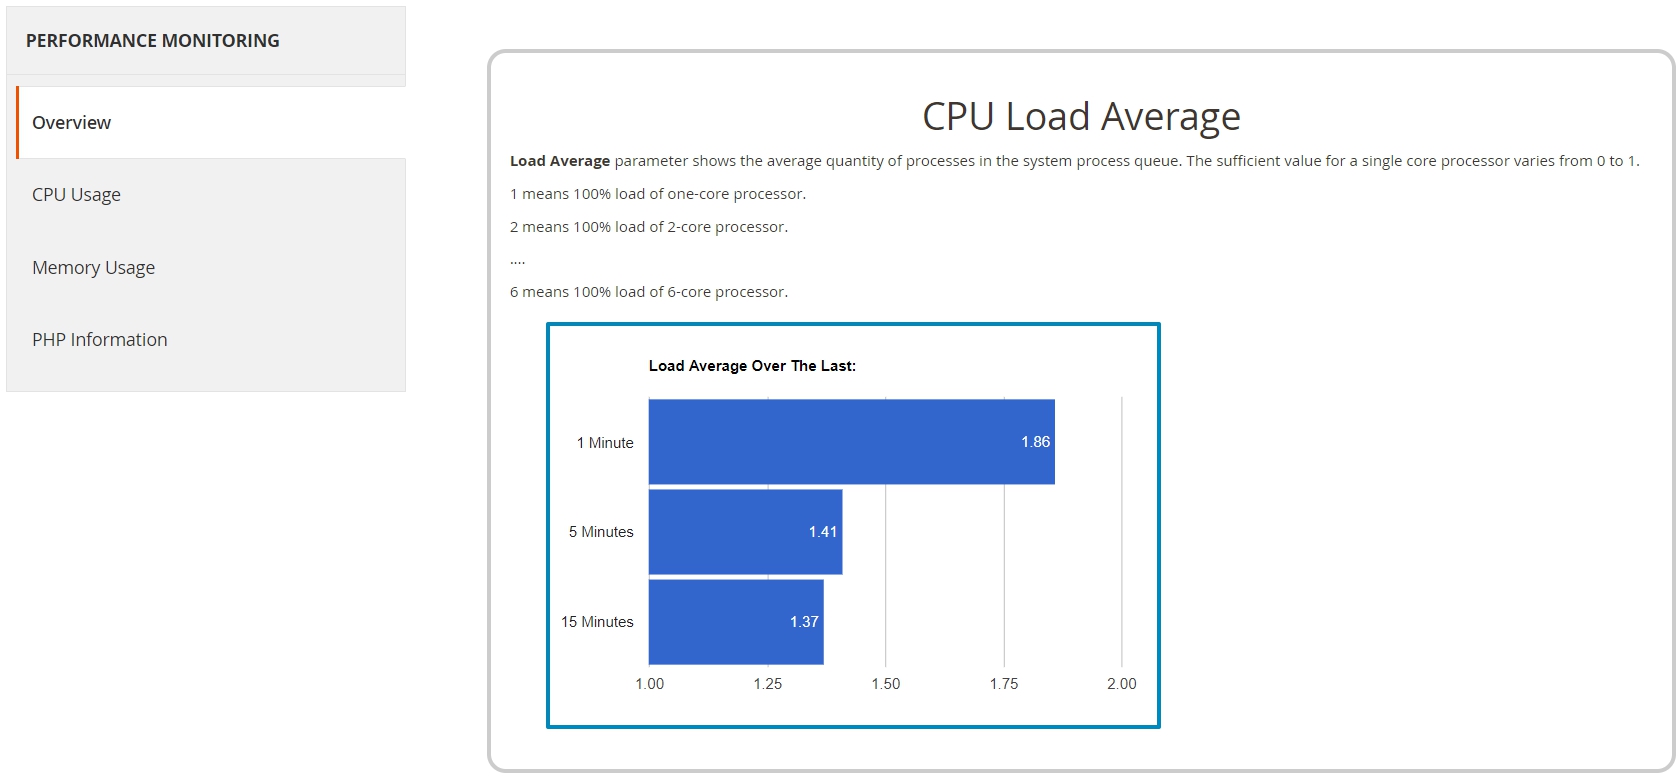
CPU Load Average
In this section, you can check CPU Load Average for the last 1, 5 and 15 minutes:
Swap Usage
A chart will be displayed here if SWAP memory was used. SWAP memory usage is a signal to increase RAM memory.
System Information
This basic information may also be useful for technical specialists (OS/CPU Model/Number of CPU Cores).
Disk Usage
Here you can keep an eye available disk space.
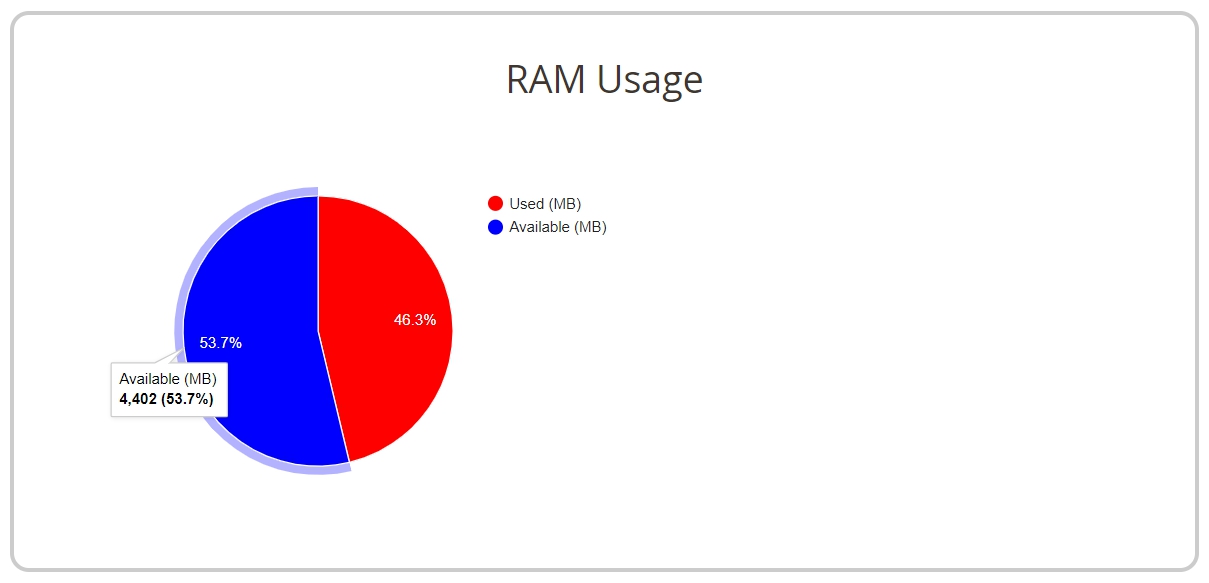
RAM Usage
Current memory usage is displayed on this pie chart:
CPU Usage Tab
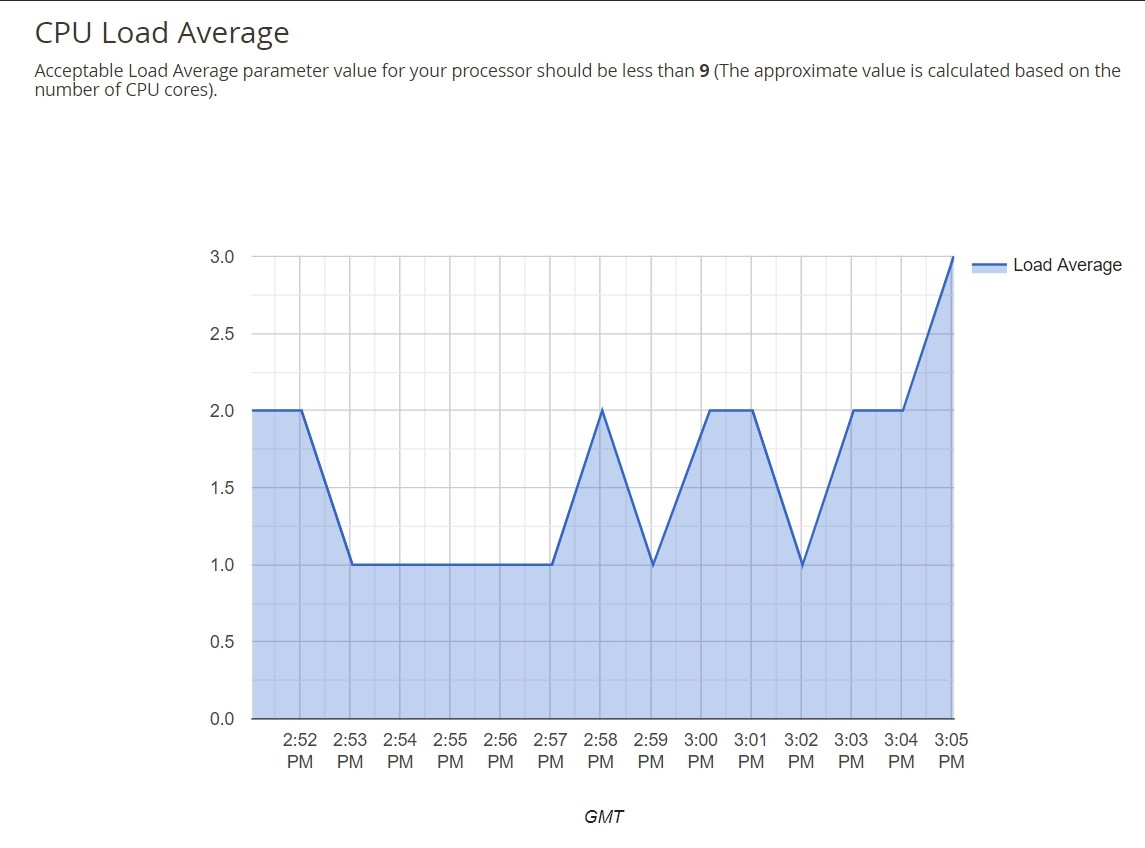
This chart displays CPU Load Average dynamics:
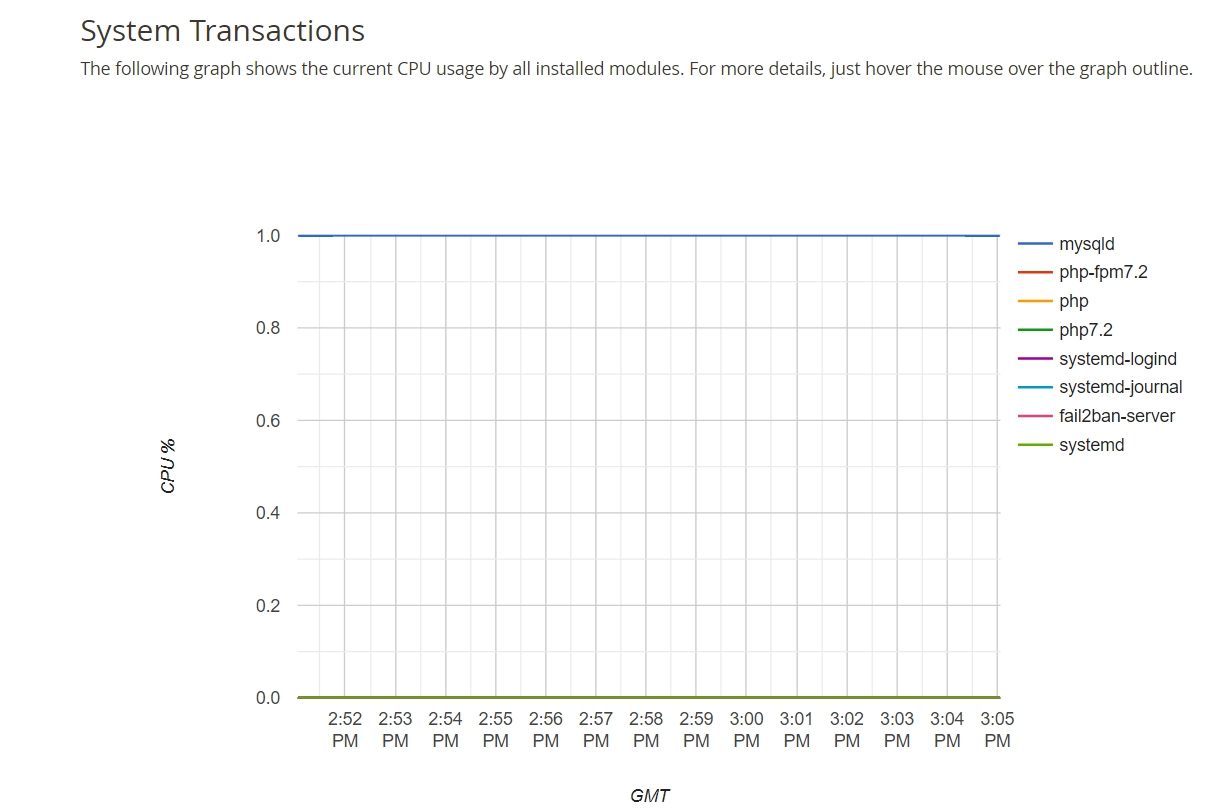
Also, in the 'System Transactions' section, you can find displayed CPU usage by installed modules:
Moreover, you'll see Top system transactions by CPU usage.
Memory Usage Tab
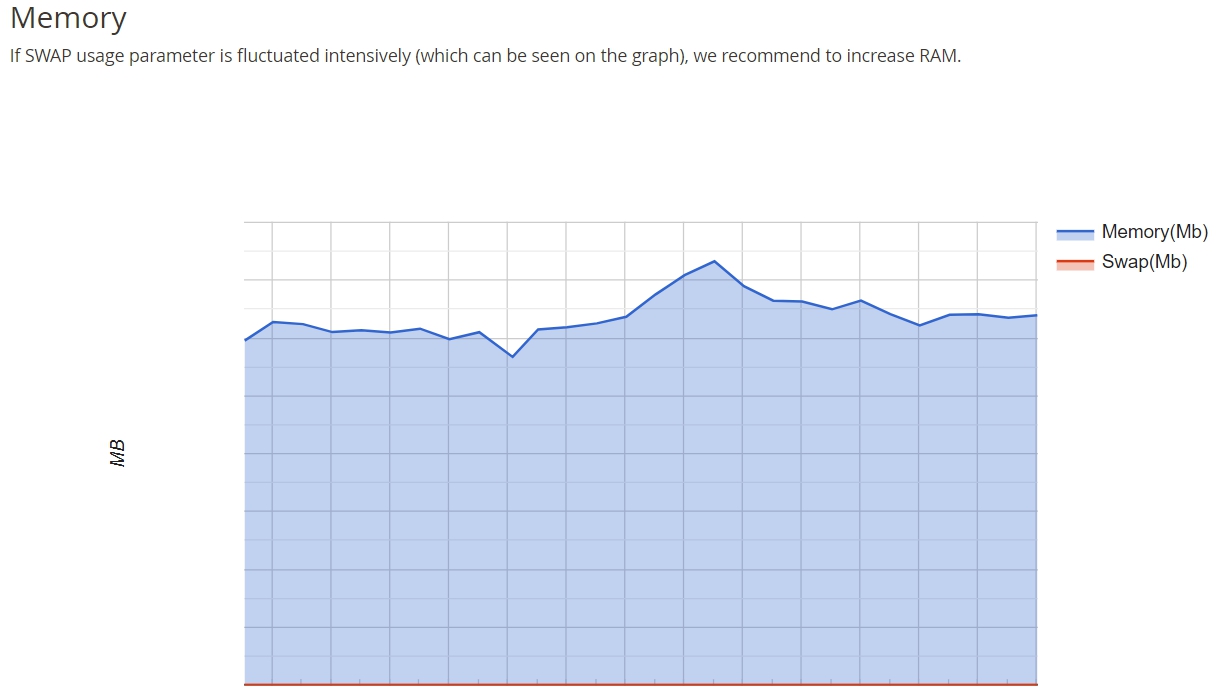
This chart displays RAM usage details:
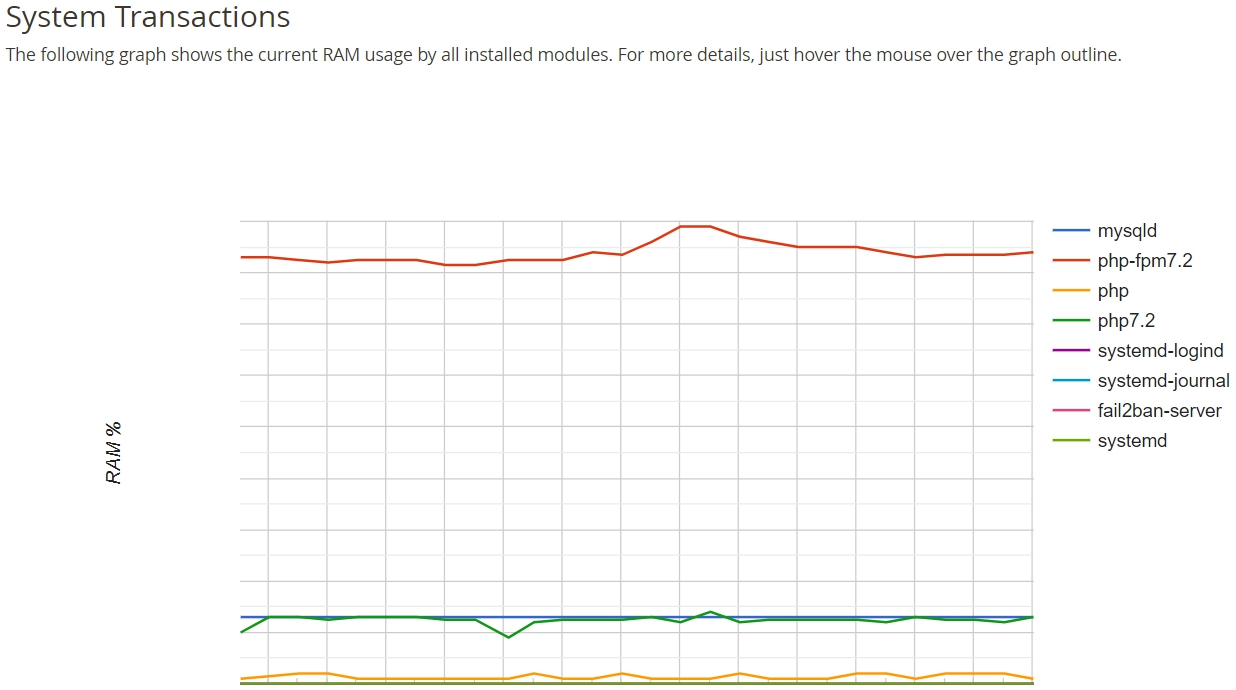
Also, in the 'System Transactions' section, you can find displayed RAM usage by installed modules:
Moreover, you'll see Top system transactions by RAM usage.
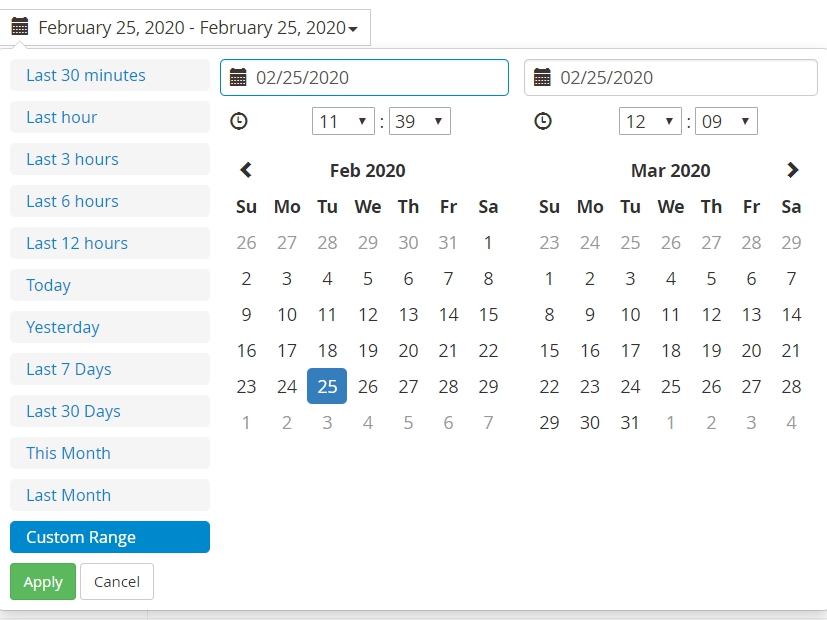
In addition to all of the above, Performance Monitoring simplified with the ability to select a specific date and time for which you would like to track:
PHP Information Tab
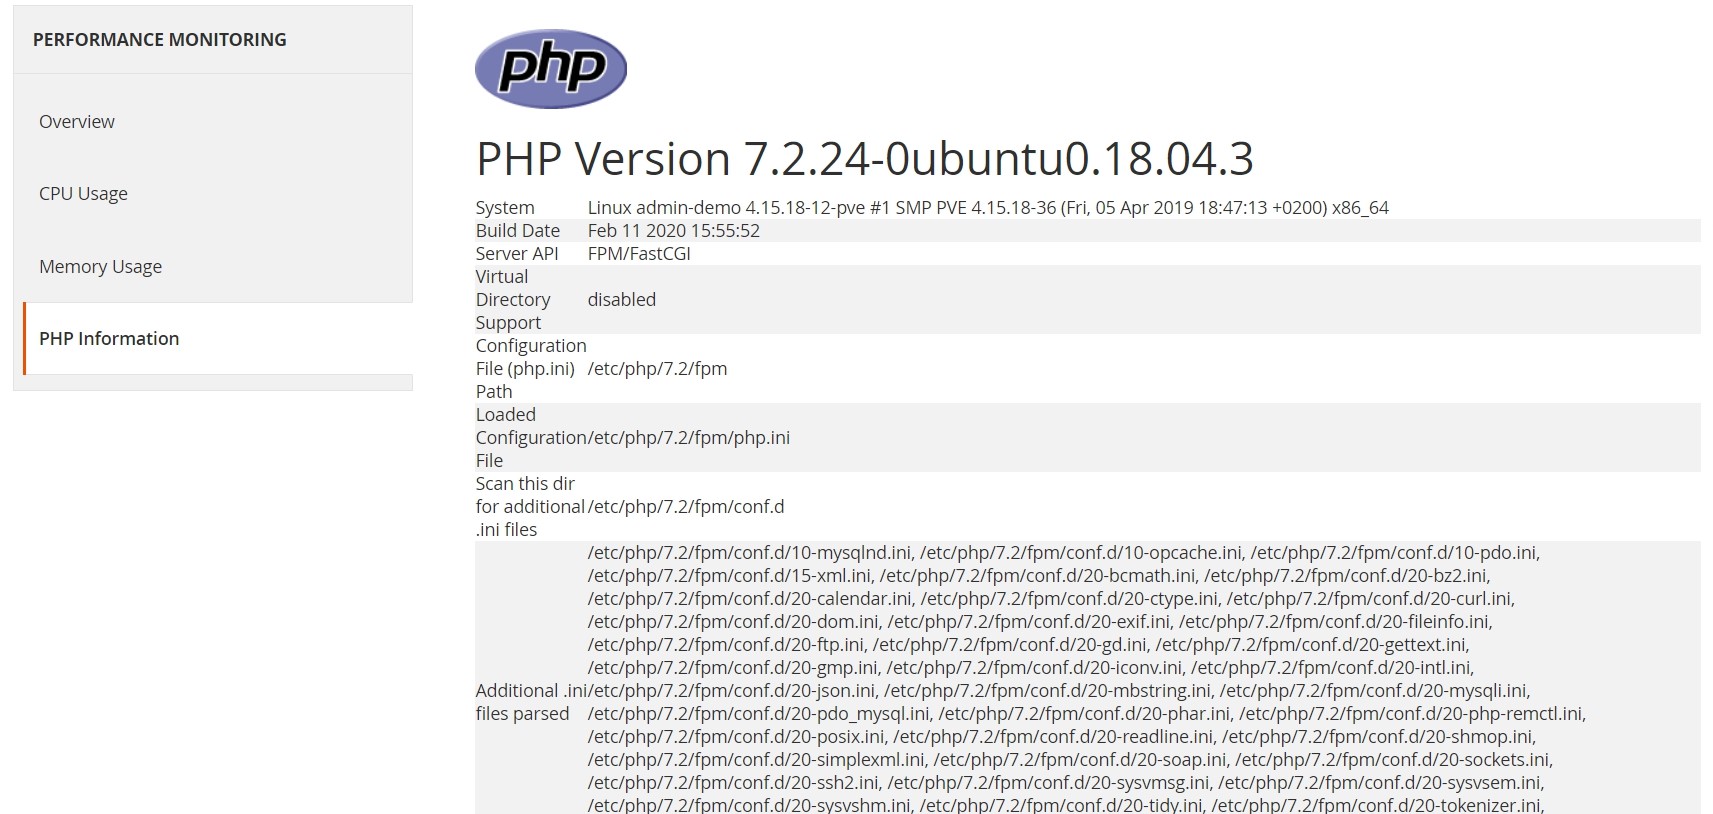
An output of PHP information is displayed here:
THANK YOU FOR CHOOSING AITOC EXTENSIONS!
