
While email is undoubtedly one of the strongest digital channels available to brands, the channel’s effectiveness still depends on the business and the tactics it’s using to implement email marketing.
So how do you know that your business’s email marketing is performing better or worse than the competition? Your answer lies in staying up-to-date with email marketing benchmarks.
In this post, we’ll walk you through actual data you can use to compare your performance against industry standards. We’ll also give you advice regarding the best day for email campaigns as well as how you can use email marketing benchmarks to improve your email marketing metrics.
Email marketing industry benchmarks
Campaign Monitor, an email service provider and multinational tech company, recently published an email marketing benchmarks guide for 2019.
Here are some of the most useful data points from that guide.
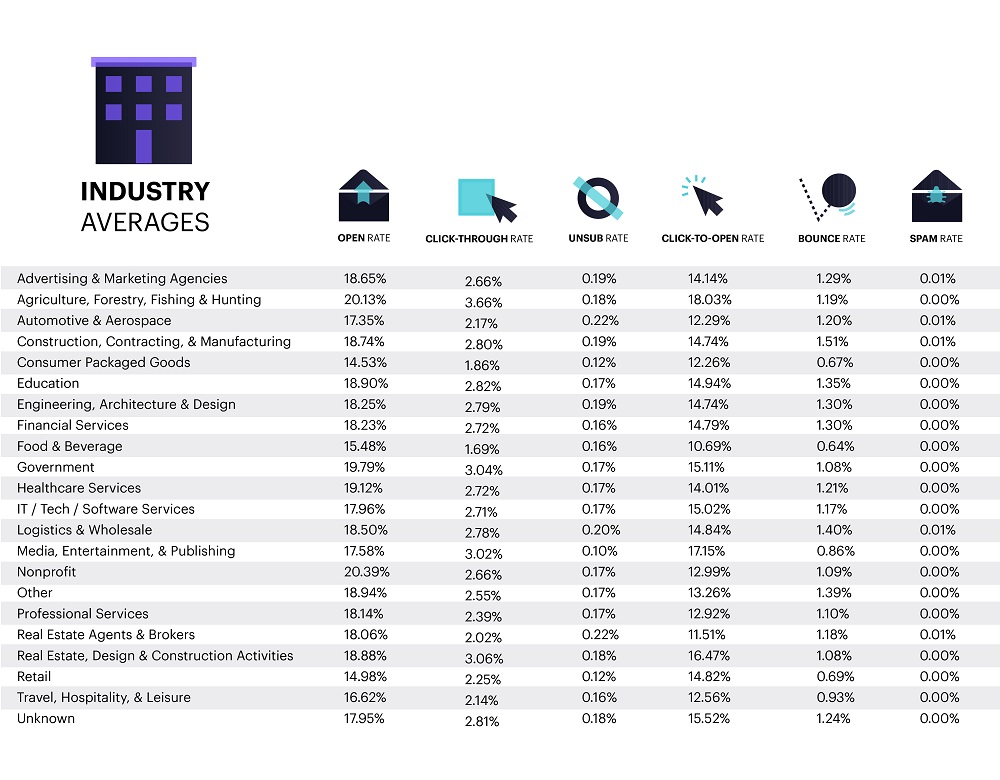
- Averages for all industries
-
- Average open rate - 17.92%
- Average click-through rate - 2.69%
- Average click-to-open rate - 14.10%
- Average unsubscribe rate - 0.17%
- Average bounce rate - 1.06%
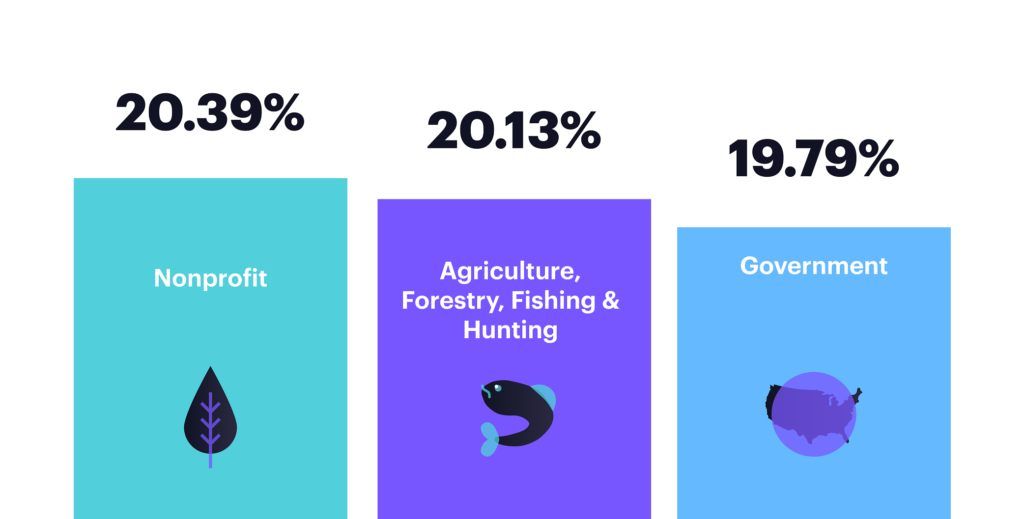
- Industries with the highest open rates
-
- Nonprofit - 20.39%
- Agriculture, forestry, fishing, and hunting - 20.13%
- Government - 19.79%
- Healthcare services - 19.12%
- Other - 18.94%
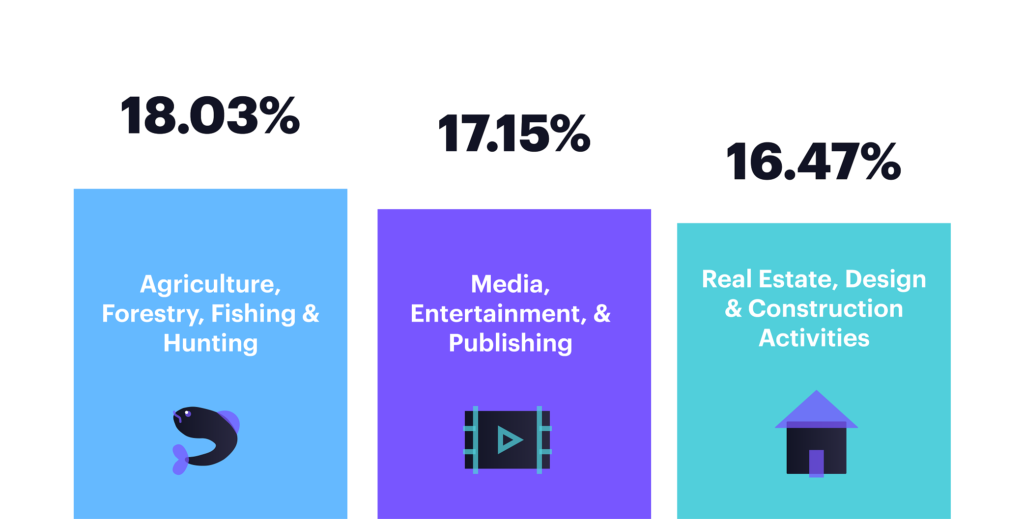
- Industries with the highest click-to-open rates
-
- Agriculture, forestry, fishing, and hunting - 18.03%
- Media, entertainment, and publishing - 17.15%
- Average click-to-open rate - 14.10%
- Average unsubscribe rate - 0.17%
- Average bounce rate - 1.06%
Ideal and non-ideal days to send your emails
Want to know the best day for email campaigns? Take a look at the following data.
- Average open rates for all industries (by day)
-
- Monday - 17.5%
- Tuesday - 18.0%
- Wednesday - 18.3%
- Thursday - 18.6%
- Friday - 18.0%
- Saturday - 17.9%
- Sunday - 17.1%
- Average click-through rates for all industries (by day)
- Monday - 2.66%
- Tuesday - 2.73%
- Wednesday - 2.71%
- Thursday - 2.70%
- Friday - 2.70%
- Saturday - 2.71%
- Sunday - 2.51%
- Average click-to-open rates for all industries (by day)
- Monday - 13.48%
- Tuesday - 14.05%
- Wednesday - 14.11%
- Thursday - 14.36%
- Friday - 14.04%
- Saturday - 14.52%
- Sunday - 14.15%
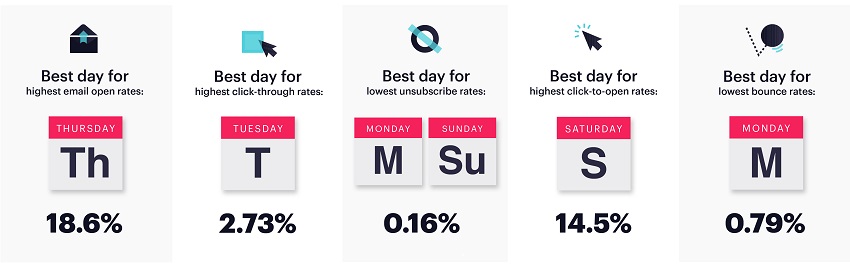
- Best days for email campaigns
-
- Day with the lowest unsubscribe rates - Sunday or Monday
- Day with the lowest bounce rates - Monday
- Day with the highest email open rates - Thursday
- Day with the highest email click-through rates - Tuesday
- Day with the highest email click-to-open rates - Saturday
- Worst days for email campaigns
-
- Day with the highest unsubscribe rates - Wednesday
- Day with the highest bounce rates - Friday
- Day with the lowest email open rates - Sunday
- Day with the lowest email click-through rates - Sunday
- Day with the lowest email click-to-open rates - Friday
Importance of using benchmarks to improve your email campaigns
Regardless of your business size or what product you sell, you can always find an opportunity to improve your email marketing strategy. And by doing so, you’re sure to maximize your email marketing ROI and engage your subscribers in the most meaningful ways.
To achieve these goals, enhance your email campaigns by leveraging email marketing benchmarks.
Here are some areas you can make simple tweaks to for immediate results.
- Open rate
Your email open rate reflects the number of subscribers (out of the total) who opened your email. As per the current benchmarks, the average email open rate is 17.92%.
If you find your open rates falling below industry standards, there are a few things you can do to correct the low rates.
- Add your subscriber’s first name to your subject line for increased email personalization.
- Leverage “power” words and phrases that grab attention such as 24-hour giveaway, on sale today only, exclusive, and limited-time special.
- Testing different send days, times, and cadence (ex. daily vs. weekly) to figure out the best days for your email campaigns.
- Click-through rate (CTR)
Your email CTR is the number of subscribers who click on a link or linked image within an email out of all the emails you sent. Since CTR is calculated based on the total number of emails you sent, it will be much lower than your click-to-open rate
Benchmarks indicate the average click-through rate to be 2.69%
Listed below are a few of the steps you can take to increase your click-through rate.
- Segment your subscribers so that each customer receives content that is relevant to their interests or demographics. A subscriber who is interested in the content you send is more likely to click your CTA.
- Entice your subscribers with strong incentives and promotions.
- Write a subject line that accurately reflects your email’s core message.
- Click-to-open rate
Your click-to-open rate is the number of subscribers who opened a specific email campaign and also clicked on the link in the email. You can use this metric to gauge how effective an email campaign was. A higher click-to-open rate means your subscribers responded well to your email.
According to 2019 benchmarks, the average click-to-open rate sits at 14.10%
To improve your click-to-open rate, you can start by implementing the following tactics:
- Optimize your emails so that they render properly on any device.
- Design CTAs that stand out. Use contrasting colors and strong action words instead of generic copy like “buy now”.
- Collect subscriber data that will help you get more in-depth with your segmentation.
- Unsubscribe rate
Your unsubscribe rate refers to the number of subscribers who opt-out of receiving future emails. High unsubscribe rates signify that your subscribers are losing interest in your emails.
According to benchmarks, the average unsubscribe rate among brands is currently 0.17%.
Even though unsubscribe rates are relatively low, it won’t hurt your brand to know how to prevent subscribers from opting out of your list. Keep the following in mind:
- Maintain email list health from the outset.
- Take advantage of automation for easy engagement with your subscribers.
- Send re-engagement emails to disinterested subscribers.
- If subscribers still don’t respond to your re-engagement emails, don’t hesitate to remove them from your list immediately.
- Bounce rate
Your bounce rate is the percentage of emails that were not delivered to their intended recipients.
The average bounce rate is 1.06%
There are two types of email bounces:
1) soft bounces
2) hard bounces.
Soft bounces are those that are caused by temporary issues such as the recipient’s inbox being at capacity at the time you sent your email. It is considered temporary because the intended recipient will still receive your email once they delete some of their other emails.
Meanwhile, hard bounces are permanent bounces caused by issues that can’t be fixed like an invalid email address.
Between these two, the only real problem is the hard bounce since it negatively impacts your sender reputation.
To avoid high bounce rates:
- Never purchase lists from third parties. These lists often contain fake email addresses.
- Never send to stale email lists.
- Always use the double-opt-in method when confirming subscriptions to your email list.
Wrap up
Benchmarks are useful because they give you a strong idea of how your email performance stacks up against your competitors as well as brands outside of your industry.
By taking a look at benchmarks, you can determine whether you are performing better or worse than others. For example, if your current click-to-open rates are lower than the standard of 14.10%, you obviously need to work on boosting your click-to-opens. This could mean optimizing your email design for mobile devices or designing better CTA buttons to attract more clicks.
