Performance Monitoring
Description
Our Performance Monitoring for Magento 2 will help merchants and admins to carefully track their Magento 2 online stores performance. This multifunctional extension preserves statistics and CPU load details in the database. It allows checking statistics in a historical context and right at the moment.
Key features:
- Get CPU and RAM load history
- Check if Random Access Memory is sufficient
- Apply email notifications when Central Processing Unit load is high
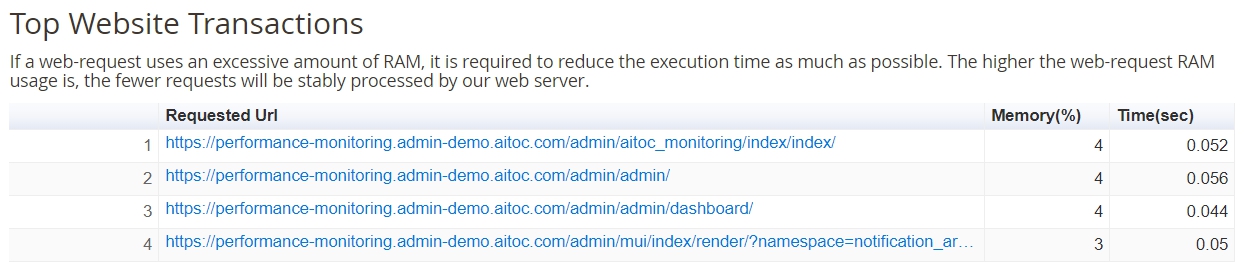
- Get the list of top website and system transactions
- Select specific periods of time with the date-picker
- Utilise the System and PHP info output
Find out how to install the Performance Monitoring for Magento 2 via Composer.
Note
All Aitoc extensions can be customised to fit particular business needs. If you have questions about any customization, please drop a message at [email protected]
Compatibility
Performance Monitoring module is compatible with the following Magento platforms:
| Community Edition (Open Source) | Enterprise Edition (Commerce) | Cloud Edition |
|---|---|---|
| 2.3.0 - 2.4.* | 2.3.0 - 2.4.* | 2.3.0 - 2.4.* |
Configuration
General
To get started, go to STORES → CONFIGURATION → AITOC EXTENSIONS → PERFORMANCE MONITORING → GENERAL to configure the extension.
Here you can Enable/Disable the module.
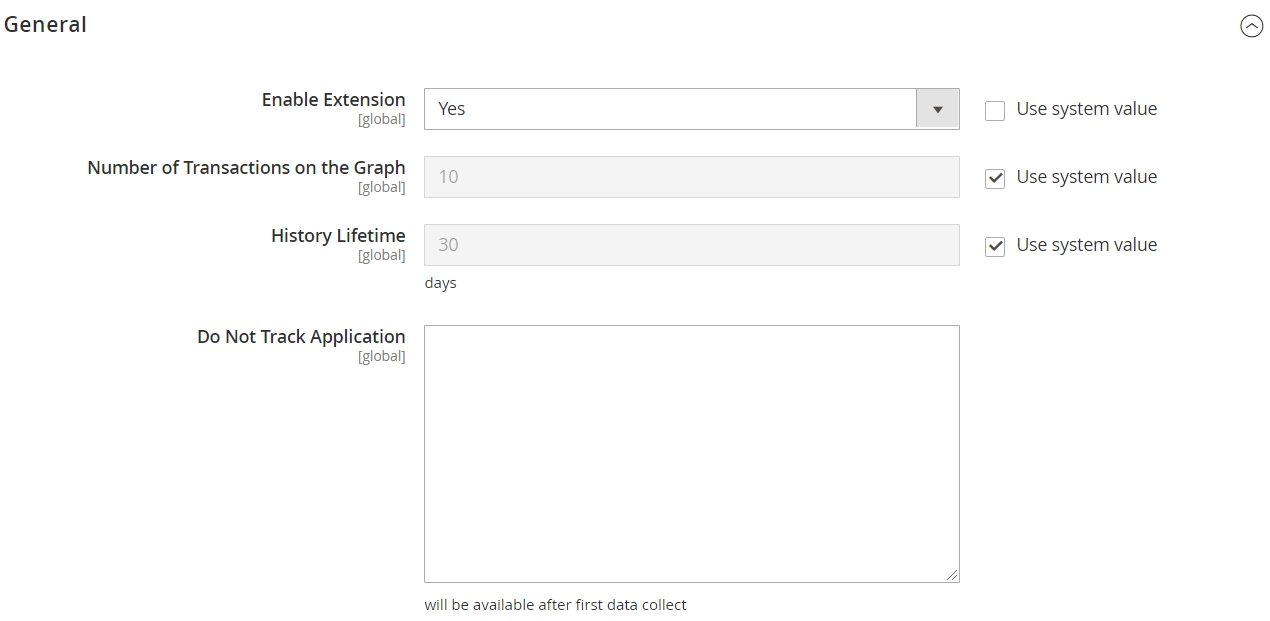
| Field | Specification |
|---|---|
| Number of Transactions on the Graph | Here it can be limited for your convenience. |
| History Lifetime | The storage period is 30 days by default, but you're able to modify it in this field. |
| Do Not Track Application | Some applications can be removed from the report for your convenience. |
Alerts
This extension can also be configured to send email notifications to an admin if CPU usage has become too high. This will help the store administrator to react timely.
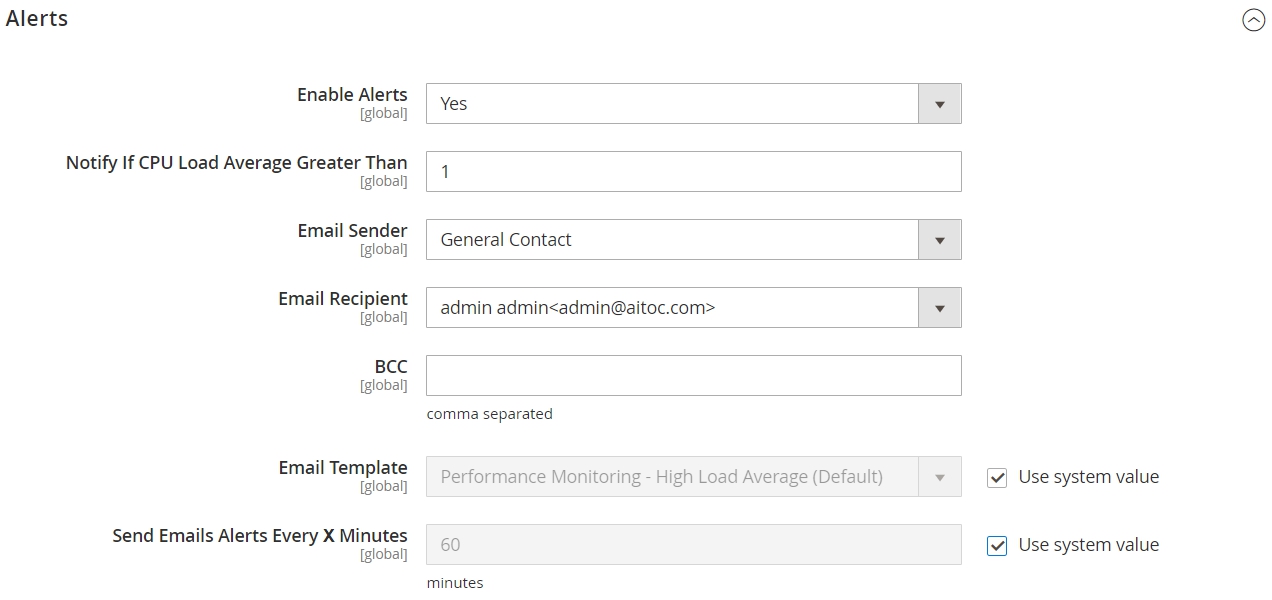
| Field | Specification |
|---|---|
| Enable Alerts | Here you can enable/disable the function. |
| Notify If CPU Load Average Greater Than | Enter a numerical value. |
| Email Sender | Select a sender from our dropdown menu: 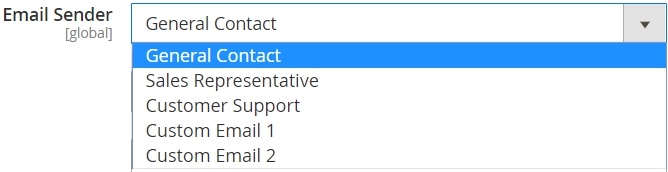 |
| Email Recipient | Specify the recipient. |
| BCC | Blind carbon copy allows the sender of a message to conceal the person entered in the BCC: field from the other recipients. |
| Email Sender | Select a sender from our dropdown menu:  |
| Send Emails Alerts Every Х Minutes | Enter your value in minutes. |
Note
After configuring, don't forget to click on 
Performance Monitoring Page
Please go to REPORTS → PERFORMANCE MONITORING.
Here you have 4 tabs: 1. Overview
-
CPU Usage
-
Memory Usage
-
PHP Information
Let's take a look at each of them.
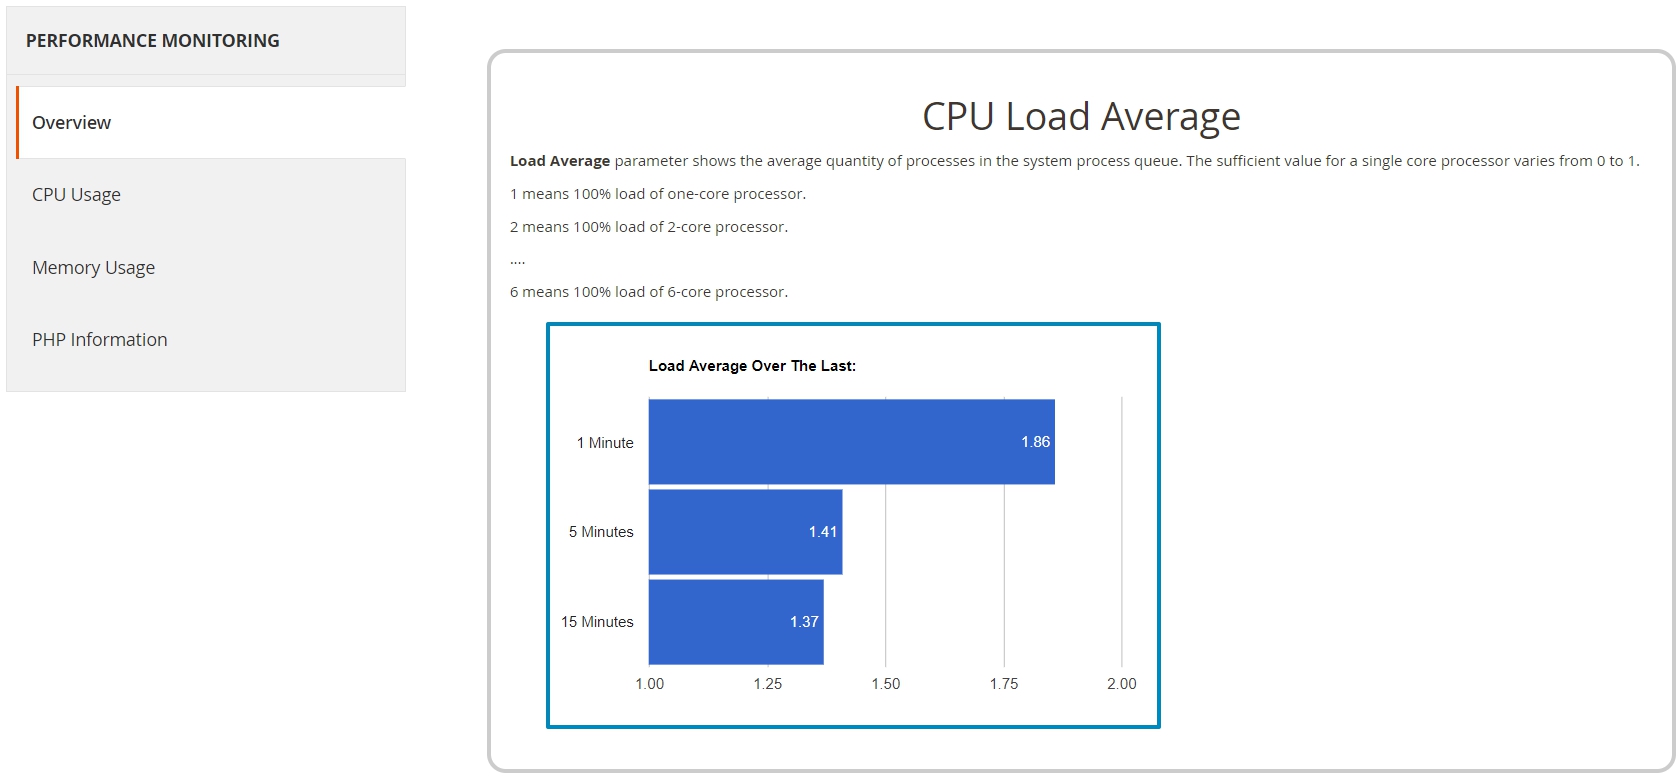
Overview Tab
CPU Load Average
In this section, you can check CPU Load Average for the last 1, 5 and 15 minutes:
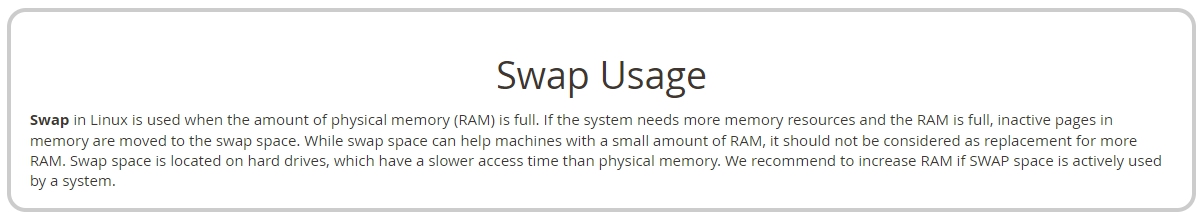
Swap Usage
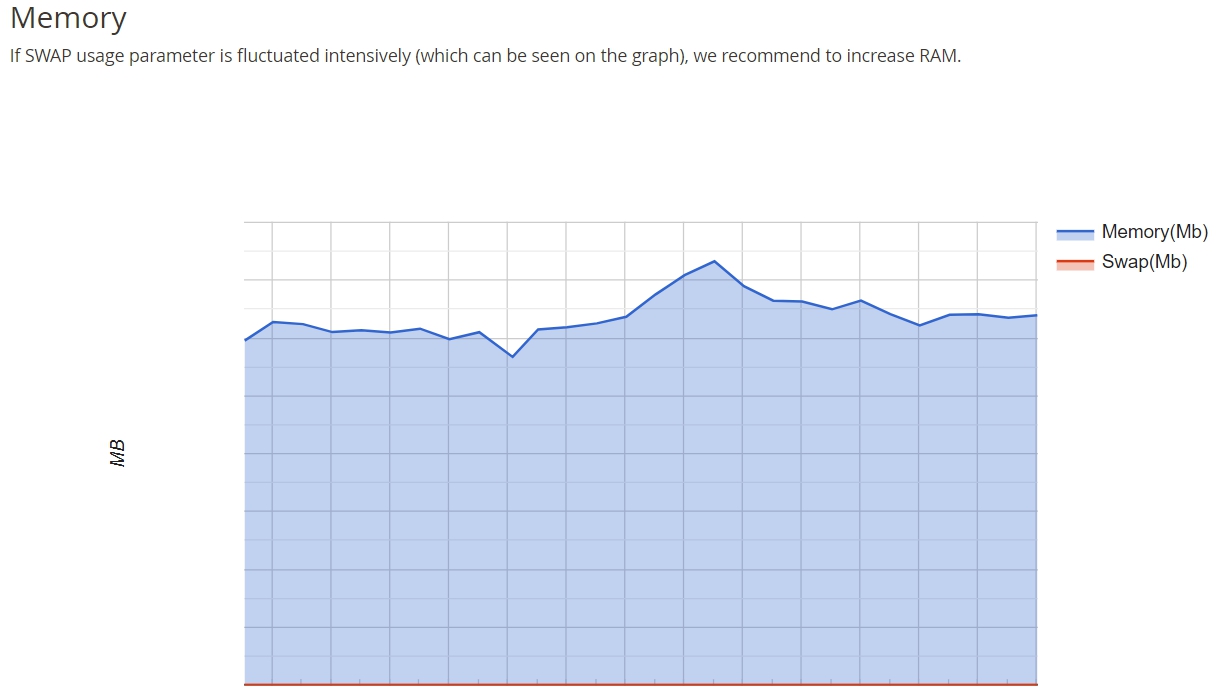
A chart will be displayed here if SWAP memory was used. SWAP memory usage is a signal to increase RAM memory.
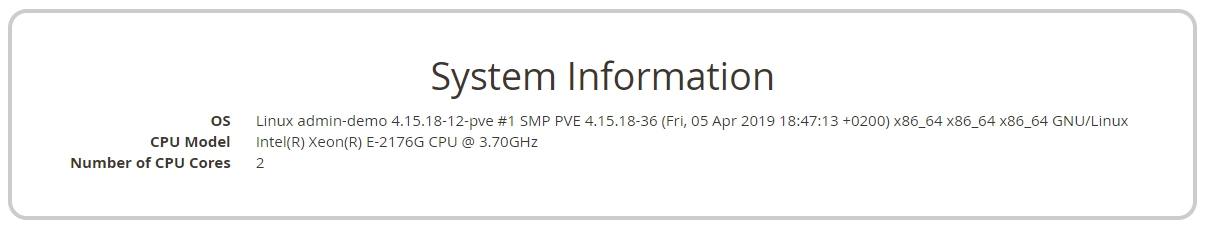
System Information
This basic information may also be useful for technical specialists (OS/CPU Model/Number of CPU Cores).
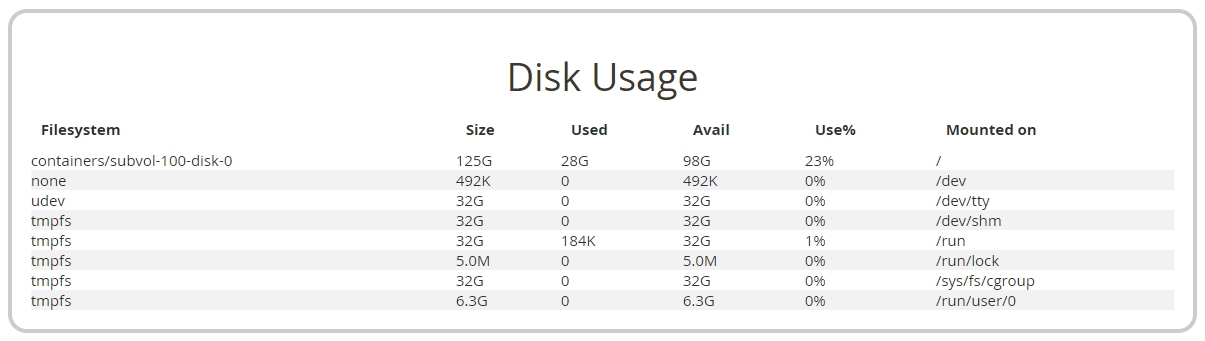
Disk Usage
Here you can keep an eye available disk space.
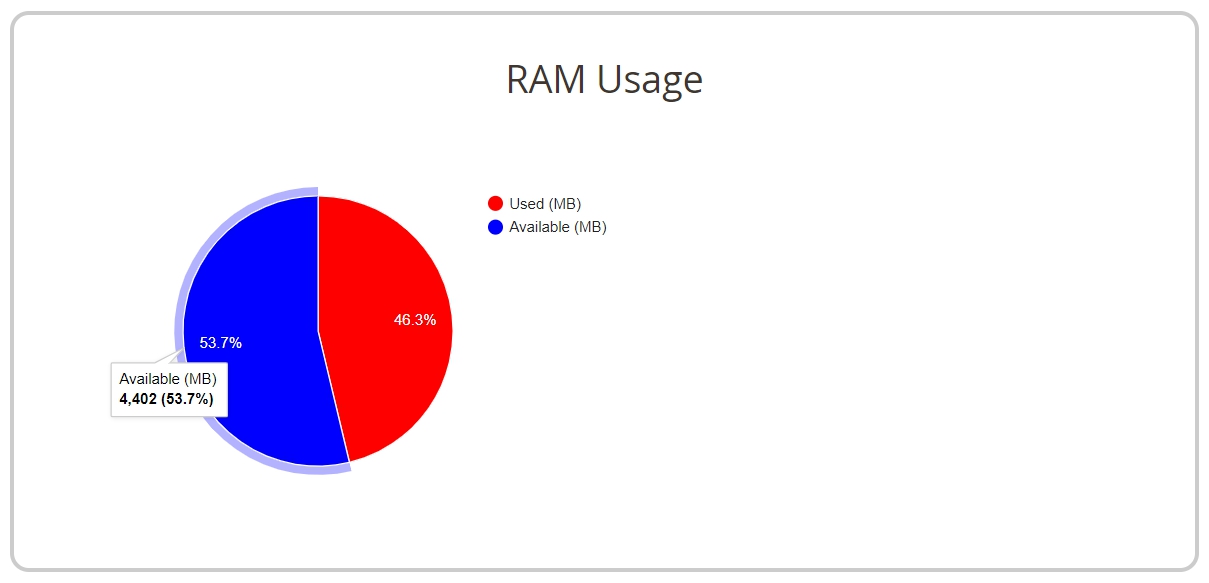
RAM Usage
Current memory usage is displayed on this pie chart:
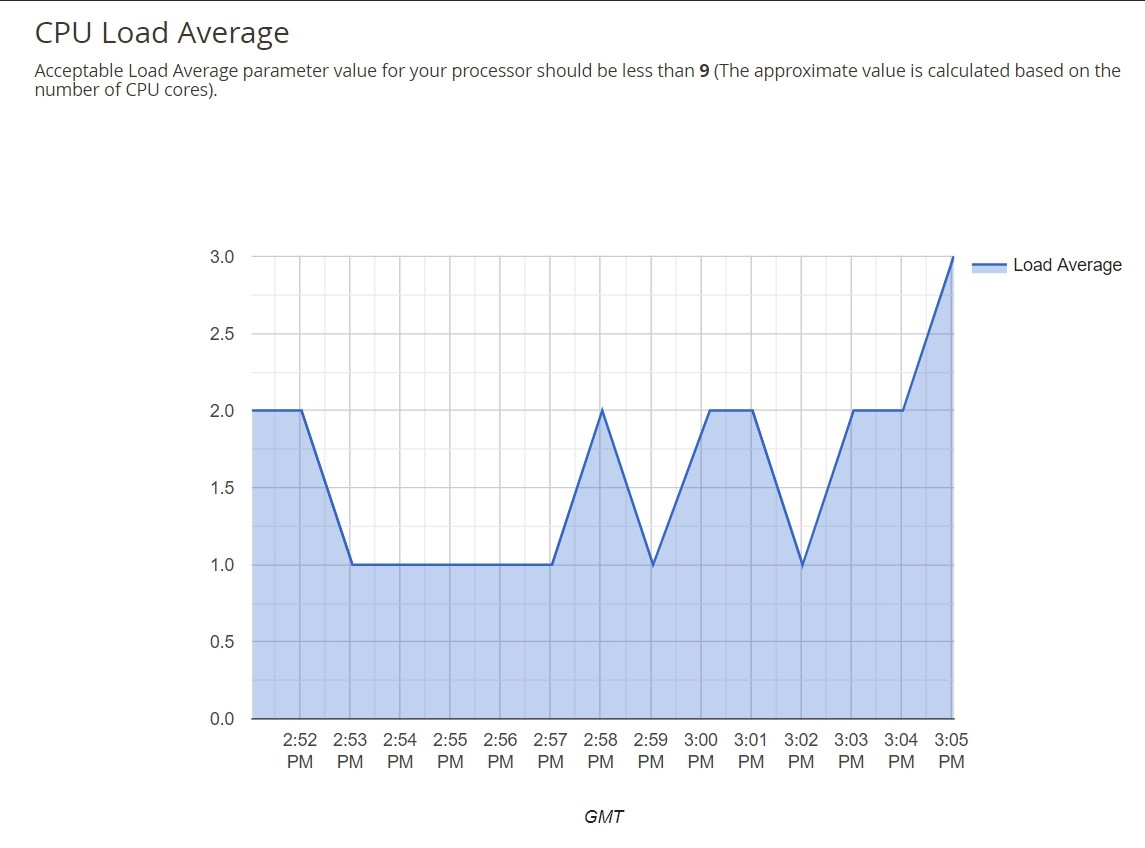
CPU Usage Tab
This chart displays CPU Load Average dynamics:
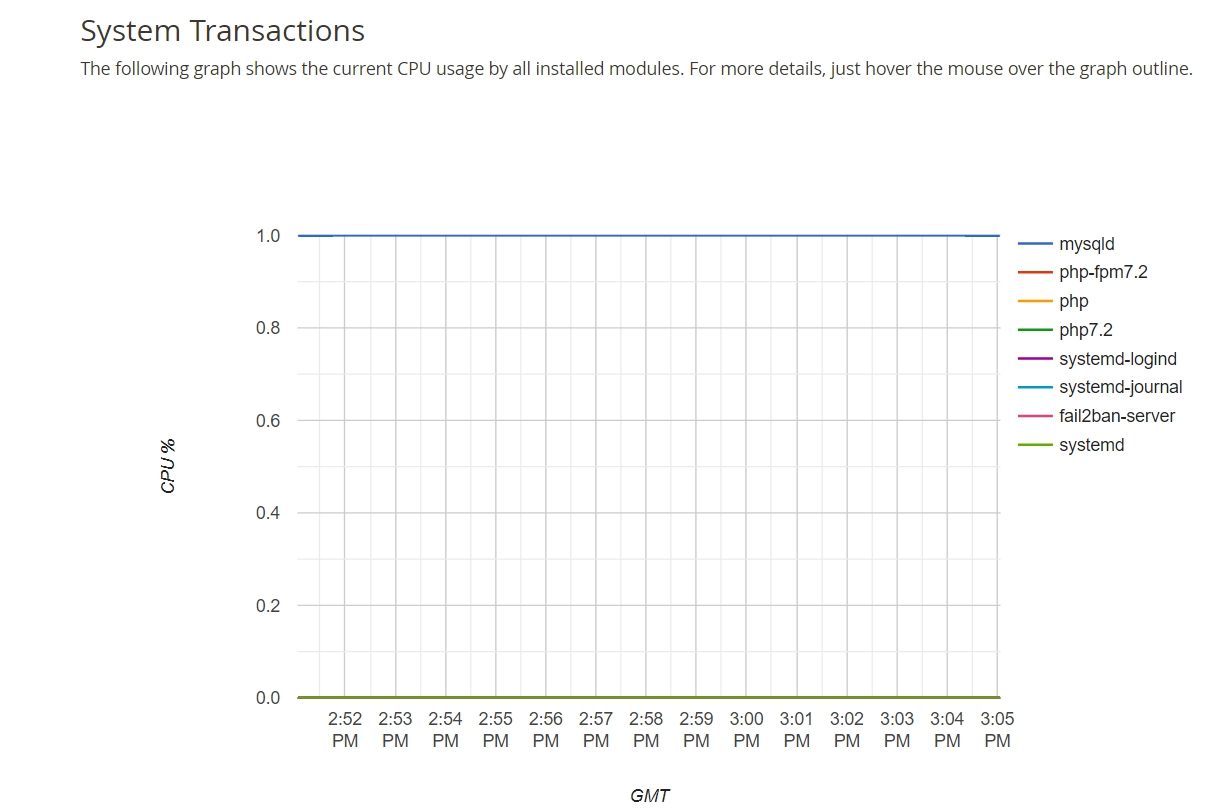
Also, in the 'System Transactions' section, you can find displayed CPU usage by installed modules:
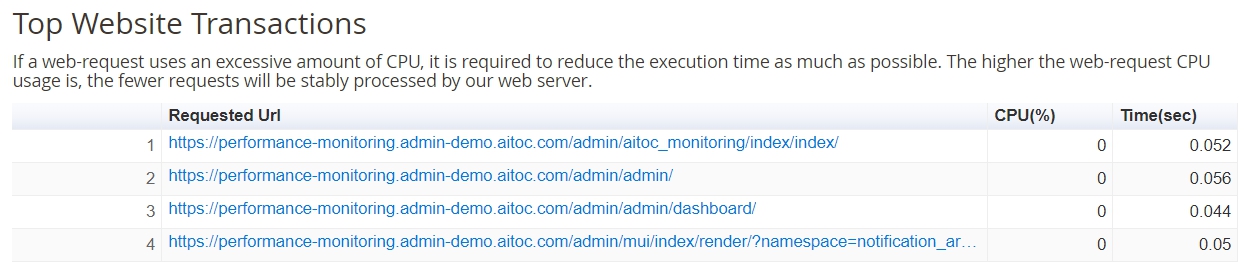
Moreover, you'll see Top system transactions by CPU usage.
Memory Usage Tab
This chart displays RAM usage details:
Also, in the 'System Transactions' section, you can find displayed RAM usage by installed modules:
![]()
Moreover, you'll see Top system transactions by RAM usage.
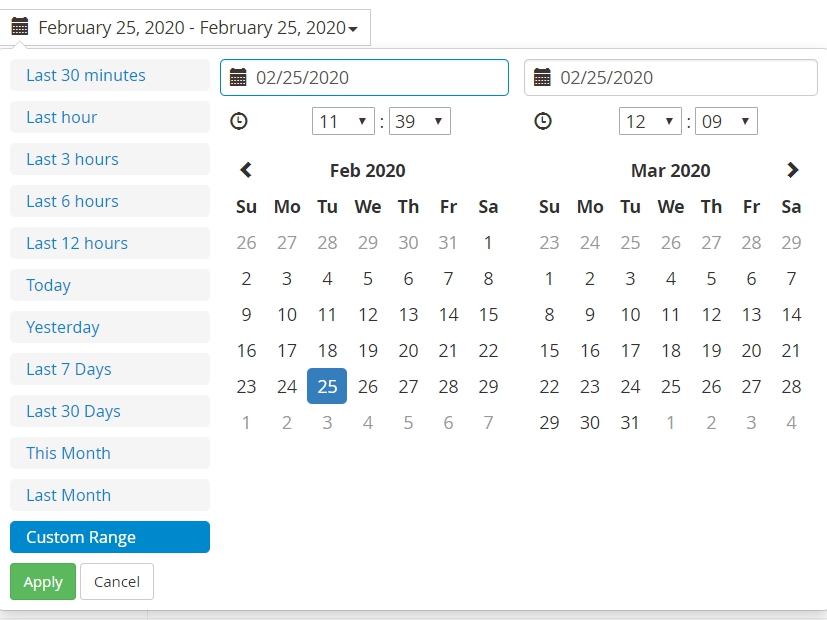
In addition to all of the above, Performance Monitoring simplified with the ability to select a specific date and time for which you would like to track:
PHP Information Tab
An output of PHP information is displayed here:

THANK YOU FOR CHOOSING AITOC EXTENSIONS!